CUTE-I Telemetry Analysis
 
 
2005/07/12 Updated
Analyzed results of CUTE-I telemetry are reported here.

  Motion Right After Separation
  Long Term Temperature Change
  Demonstration of communication protocol
  Temperature Fluctuation along Orbit

# Motion Right After Separation -> 2003/08/08 Completed
    At 300 seconds after the separation, three monopole antennas of CUTE-I were successfully deployed. The following graphs show angular velocity at near the deployment time. Precise antenna deployment time is 303s. The angular velocity starts to change at 303s. The antennas are coiled around b2-axis(in CUTE_Frame) of CUTE-I, so the antennas deployment influences the rotation around b2-axis. The following graph certainly indicates the effect of antenna deployment.


Definition of CUTE-I's Coordinates


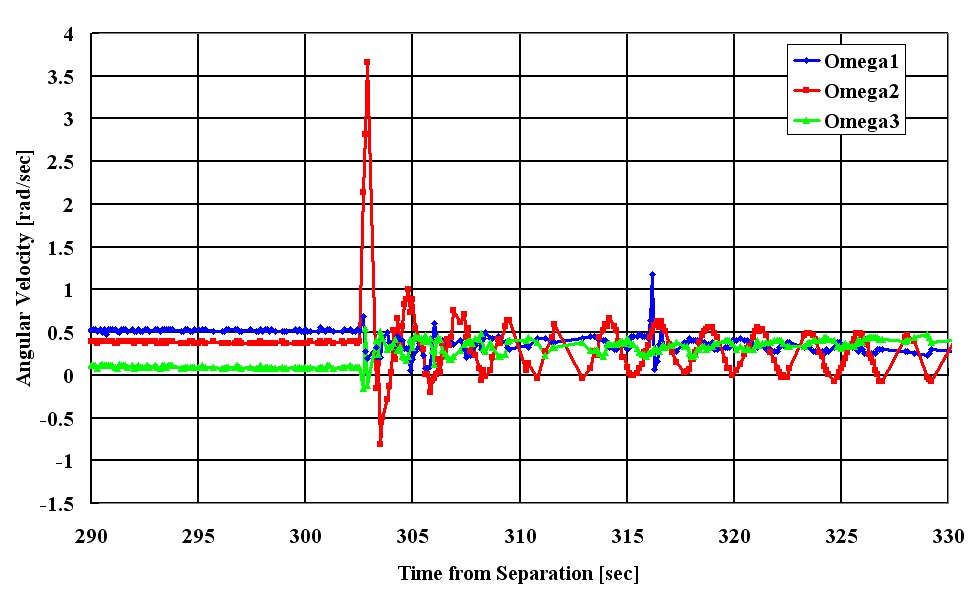
Angular velocity at near 300sec after separation from gyro sensor


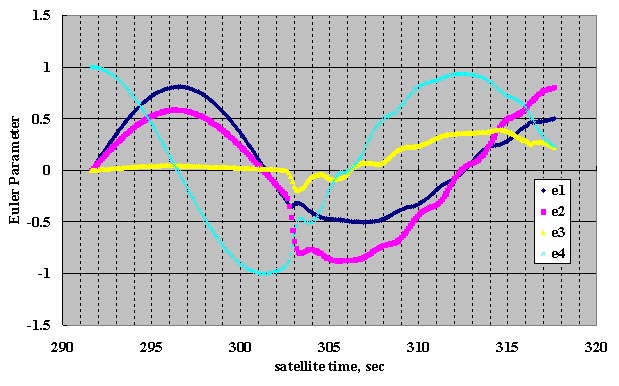
Euler parameter at near 300sec after separation


# Long Term Temperature Change -> Now on mission
2003.7-2003.8


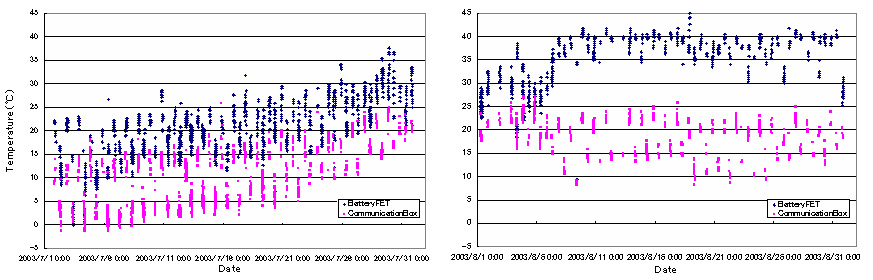
Temperature history(2003.7.1-2003.8.31)

 
2003.7-2004.5


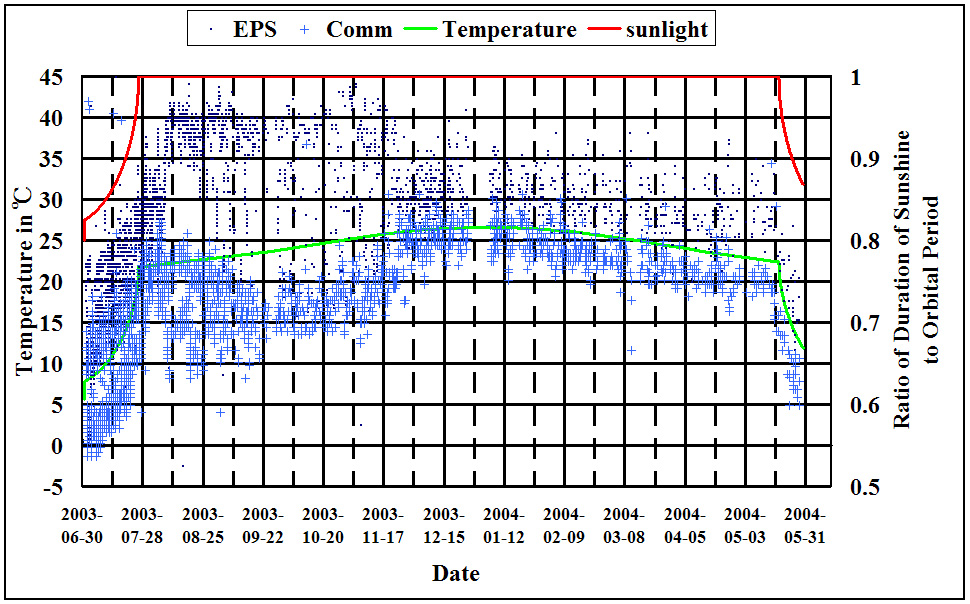
Temperature history(2003.7-2004.5)

 
2004.5-2004.7


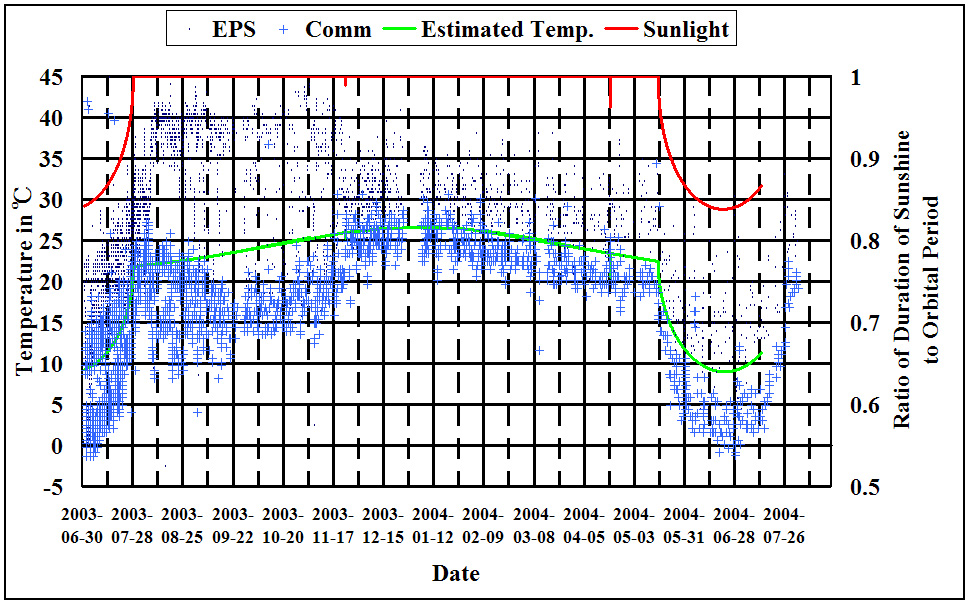
Temperature histroy(2003.7-2004.7)

 
2003.7-2005.7 (05/07/12 updated)


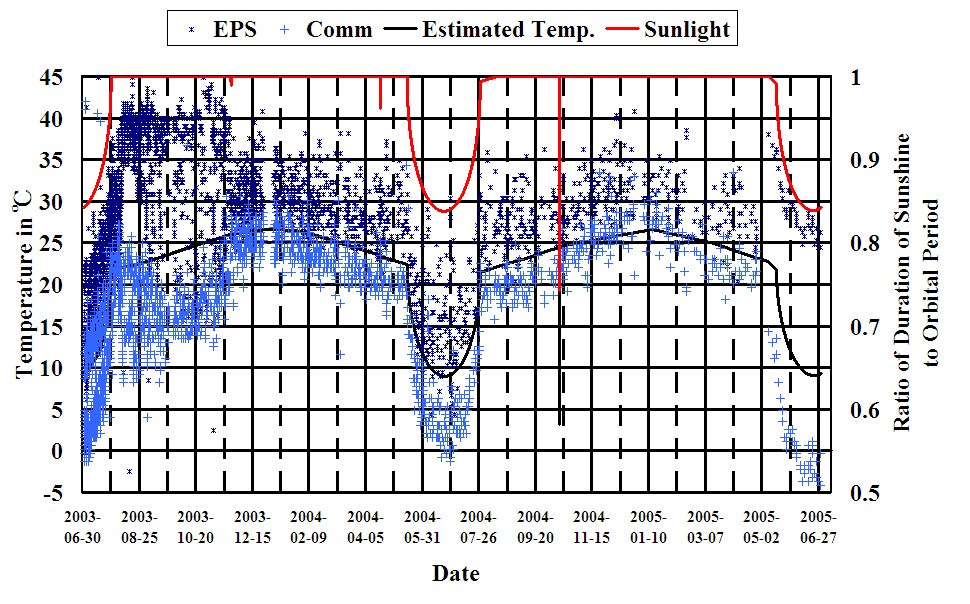
Temperature history(2003.7-2005.7)


# Demonstration of communication protocol-> Now on mission
   

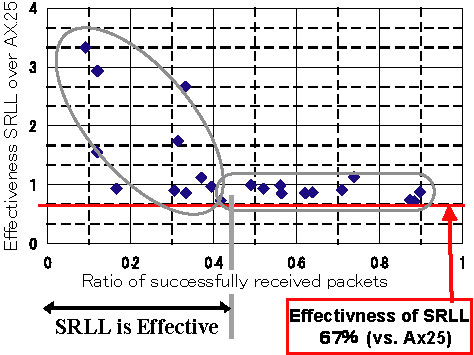
Ratio of successfully received packets
 

# Temperature Fluctuation along Orbit-> Completed


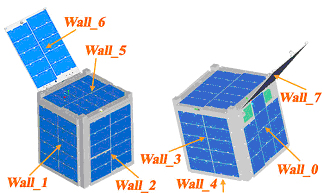
Definition of wall’s number


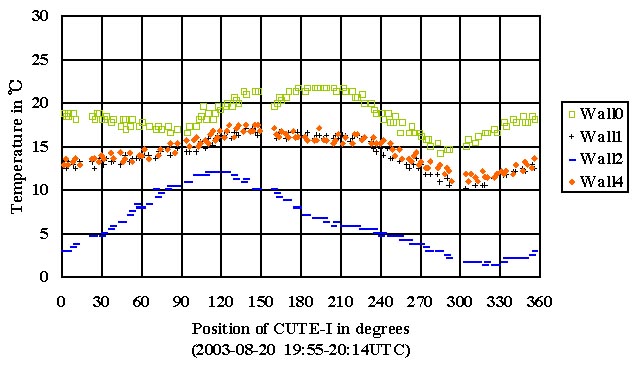
Temperature Fluctuation in Orbit (Aug 20)
 

# Sun Sensor Test-> Completed


# Motor Test-> Completed


# Check of Onboard Memory(SRAM) -> Completed
    under construction